“The league table never lies!” and it usually doesn’t, but sometimes, there’s a bit more that can be extracted from league results, especially during the early parts of the season. If a team has faced difficult opponents, but has the same number of points as another team with a much easier schedule, then the points’ total may not reflect the whole picture. This is an attempt to produce an alternative league table which takes into account the strength of schedule faced by each team. For lack of a better name, I’ve called it the Schedule-Adjusted League Table.
The idea behind the Schedule-Adjusted League Table is to compare the teams based on their results against the same opponents. Using the Premier League as an example, take Arsenal and Tottenham. As of the 11th of November, these are their matches played:
Arsenal Matches
Tottenham Matches
Opponent
Venue
Opponent
Venue
Man City
Home
Newcastle
Away
Chelsea
Away
Fulham
Home
West Ham
Home
Man United
Away
Cardiff
Away
Watford
Away
Newcastle
Away
Liverpool
Home
Everton
Home
Brighton
Away
Watford
Home
Huddersfield
Away
Fulham
Away
Cardiff
Home
Leicester
Home
West Ham
Away
Crystal Palace
Away
Man City
Home
Liverpool
Home
Wolves
Away
Wolves
Home
Crystal Palace
Away
Out of their 12 matches each team has played so far, there are 4 of them that are against the same opponents, at the equivalent venue (home or away). These are shown in the following table, accompanied by the number of points each of Arsenal and Tottenham have secured in each match:
Arsenal
Tottenham
Opponent
Venue
Result
Points
Result
Points
Man City
Home
Lost
0
Lost
0
Newcastle
Away
Won
3
Won
3
Crystal Palace
Away
Drew
1
Won
3
Liverpool
Home
Drew
1
Lost
0
Of these 4 matches, Tottenham took 6 points (or 1.50 per game) whereas Arsenal took 5 points (1.25 per game). Using the same basis to compare these two teams, we might argue that Arsenal are slightly worse than Tottenham at a rate of 1.25 – 1.50 = -0.25 points per game. Let’s now turn our attention to another pair, Arsenal and Man United. Using the same procedure we find that these two teams have both faced the following 4 opponents at the equivalent venues:
Arsenal
Man United
Opponent
Venue
Result
Points
Result
Points
Chelsea
Away
Lost
0
Drew
1
Everton
Home
Won
3
Won
3
Leicester
Home
Won
3
Won
3
Wolves
Home
Drew
1
Drew
1
Man United took 8 points (2.00 per game) from these 4 matches, whereas Arsenal had 7 points (1.75 per game). This would suggest that Arsenal are slightly worse than Man United too (also at a rate of -0.25 per game). So let’s now compare Man United with Tottenham. Same drill as before, here are their 3 common opponents:
Man United
Tottenham
Opponent
Venue
Result
Points
Result
Points
Brighton
Away
Lost
0
Won
3
Watford
Away
Won
3
Lost
0
West Ham
Away
Lost
0
Won
3
Man United took 3 points whereas Tottenham had 6. There was also a match between the two teams which ended in a win for Tottenham, so out of these combined 4 matches Man United had 0.75 points per game whereas Tottenham had 2.25 (a difference of -1.50 points per game from Man United’s point of view). Overall, there are 190 pairs of teams in the Premier League which we need to compare. Note that the pair Arsenal-Tottenham is the same as the pair Tottenham-Arsenal.
We can compute the relative difference in points per game for each of these pairs and then solve an overdetermined system of equations (190 equations with only 20 unknowns) to find the rating for each of the 20 teams.
As there will most likely be no exact solution to the system, we estimate the solution by minimizing the sum of squared errors. More specifically, for a 20-team league, we construct W, a 190 x 20 matrix (one row for each pair of teams, one column for each team), a 20 x 1 vector x, which stores the ratings of each team (to be calculated) and a 190 x 1 vector r which has the relative difference in points gained per match. The W matrix consists of 0s apart from the column corresponding to the pair’s first team where the matrix element takes the value 1, and the column corresponding to the pair’s second team where the matrix element takes the value -1. To illustrate this, in a 4-team league, where there would be a total of 6 pairs, the W matrix would be given by:
(Team A)
(Team B)
(Team C)
(Team D)
(Pair A-B)
1
-1
0
0
(Pair A-C)
1
0
-1
0
(Pair A-D)
1
0
0
-1
(Pair B-C)
0
1
-1
0
(Pair B-D)
0
1
0
-1
(Pair C-D)
0
0
1
-1
Essentially, the system that we need to solve is defined by Wx = r. As there will generally be no solution to the system, we can approximate it by minimizing the sum of squared errors, which leads to the ratings solution vector given by:
x = (WTW)-1WTr
where the inverse is a generalized inverse. Once the ratings solution vector x is calculated, a suitable scaling is applied – huge thanks to Christopher D. Long (@octonion) for the help provided in this part – and the schedule-adjusted points for team i is given by:
AdjPtsi = mi * (xi + TotPts/2n)
The results from this analysis in tabular and graphical form are presented below (after 12 Premier League matches):
Actual Points
Adjusted Points
Man City
32
33.67
Liverpool
30
30.94
Tottenham
27
29.57
Arsenal
24
26.61
Chelsea
28
26.44
Man United
20
22.4
Everton
19
19.5
Watford
20
18.46
Wolves
16
18.04
Bournemouth
20
18.03
Leicester
17
17.22
Brighton
14
14.54
West Ham
12
13.86
Crystal Palace
8
9.32
Newcastle
9
7.18
Huddersfield
7
7.11
Burnley
9
6.71
Southampton
8
5.87
Cardiff
8
5.45
Fulham
5
2.08
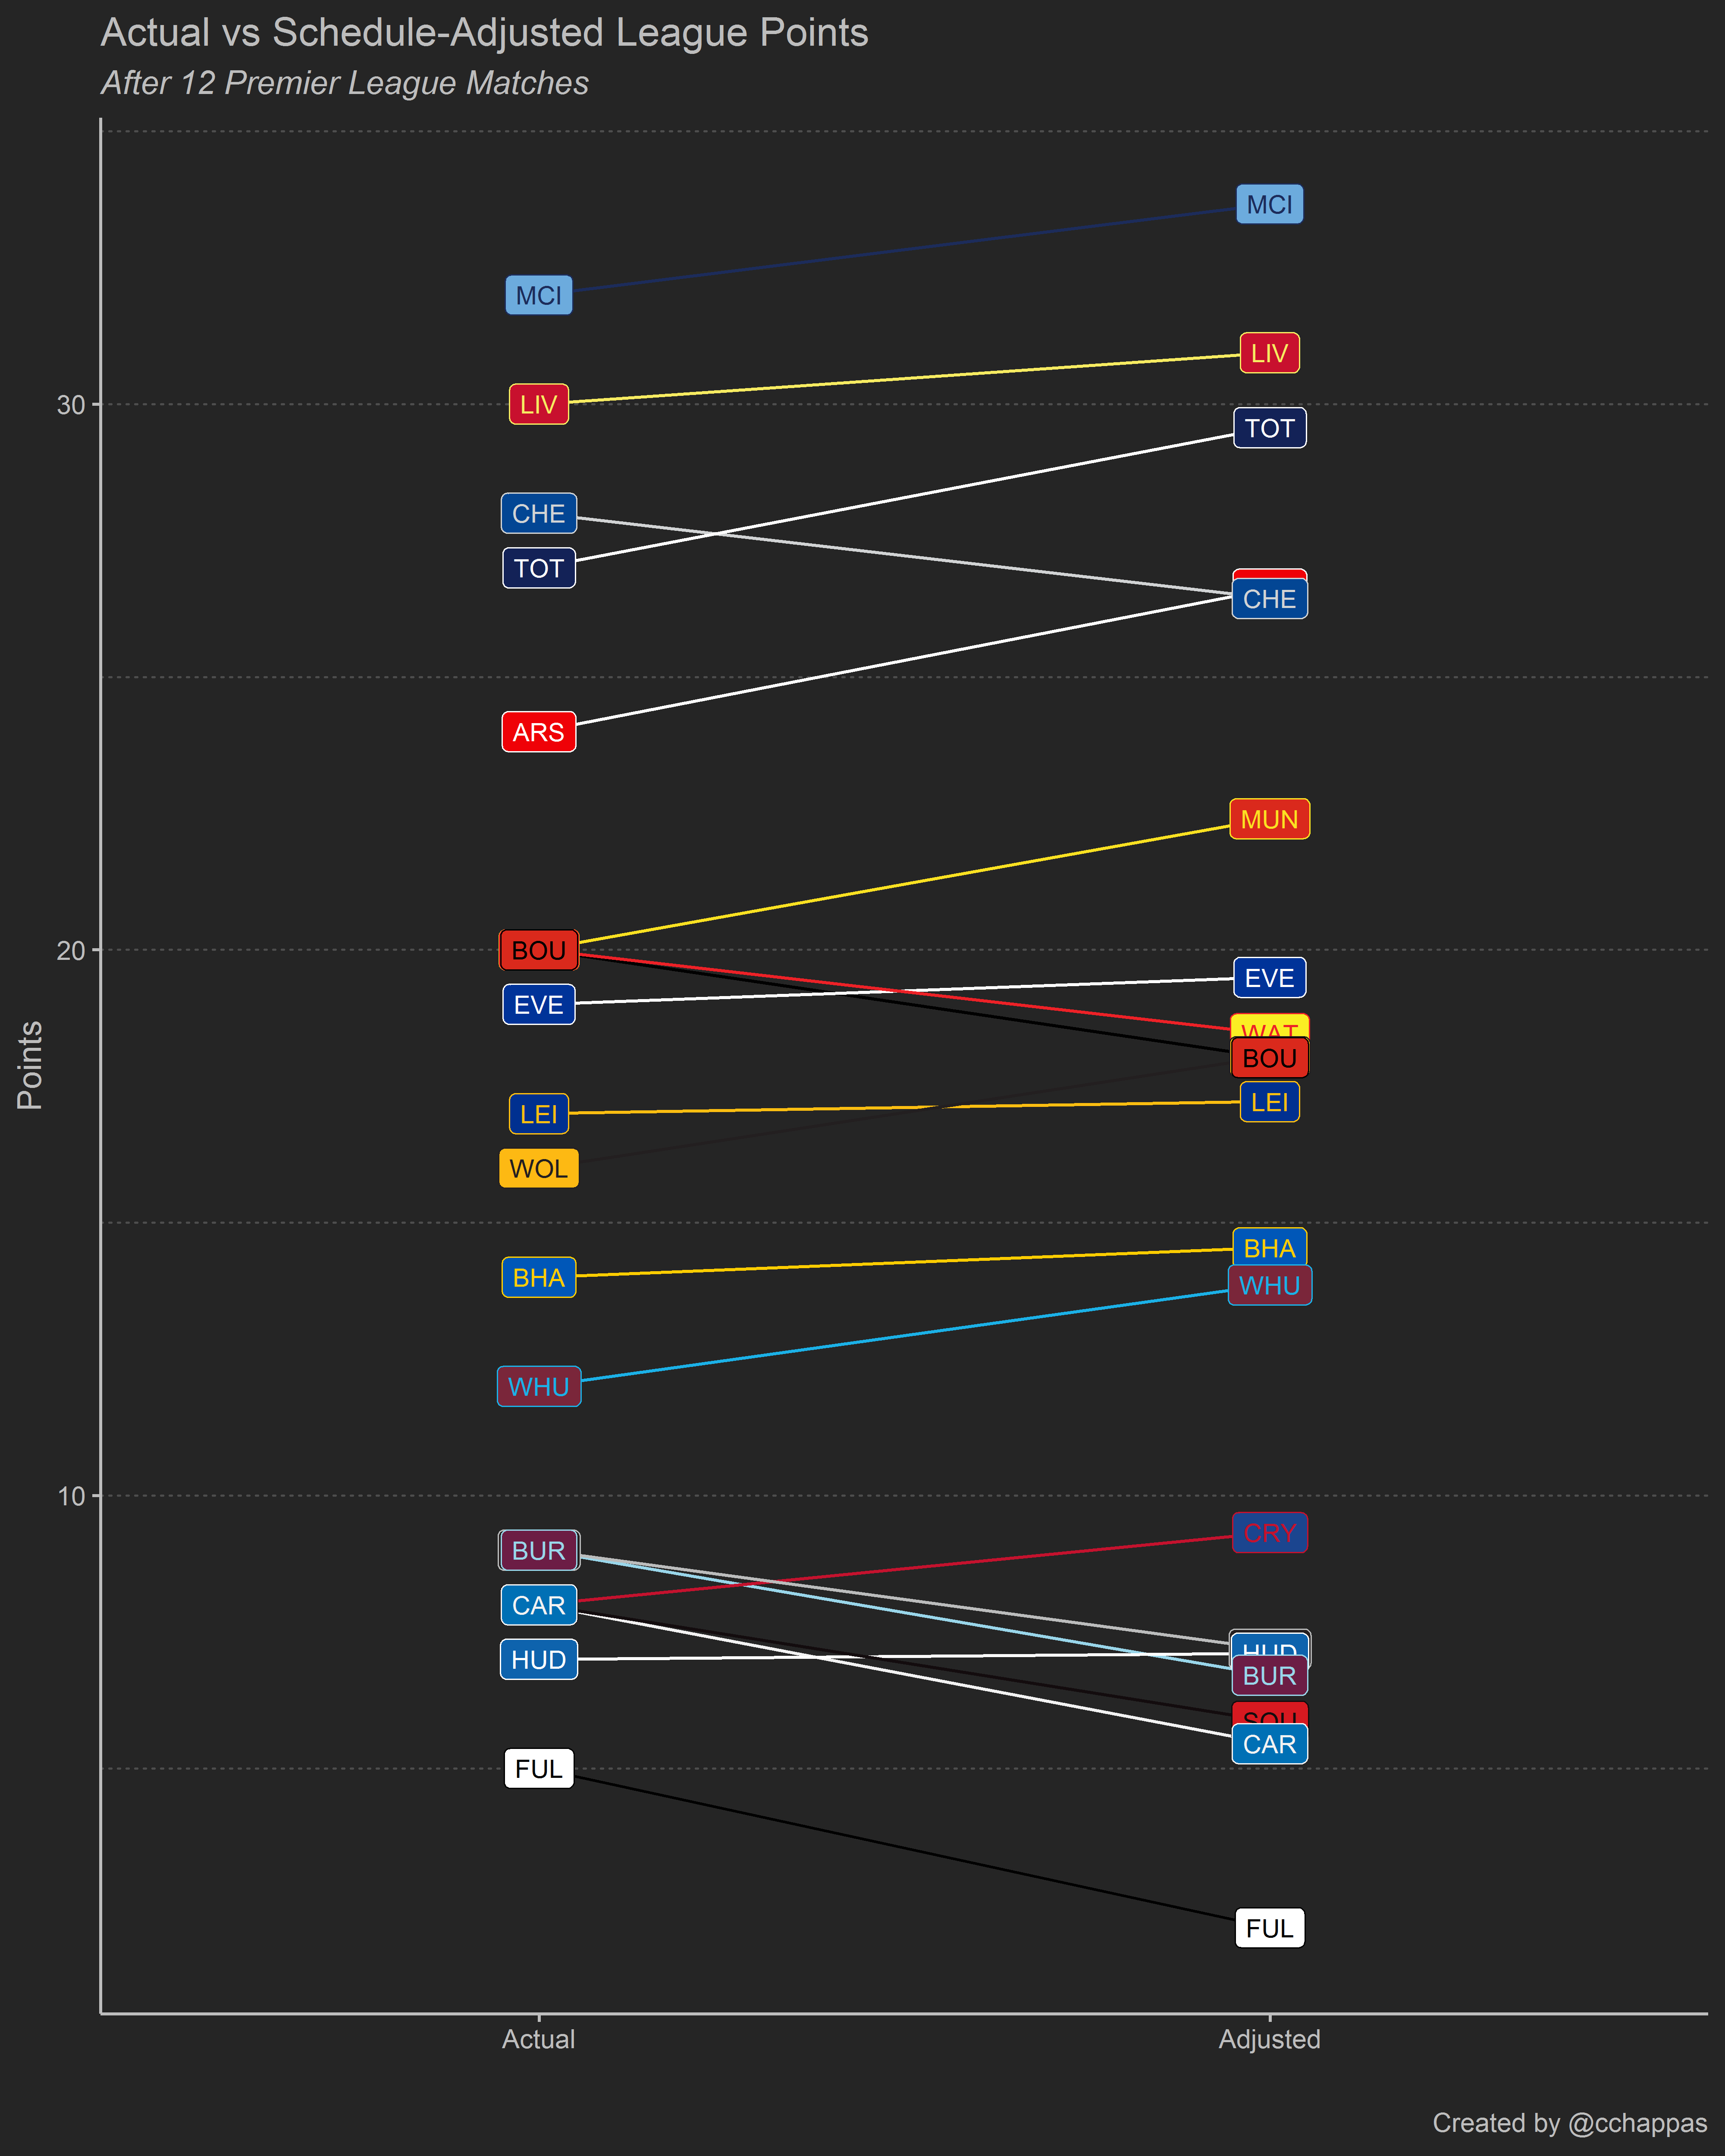
This methodology would suggest that teams like Arsenal, Tottenham, Man United and Wolves have registered points’ totals which underestimate the true value of those wins and draws. On the other hand, the value of the points gained by teams like Fulham, Cardiff, Burnley and Southampton is in fact lower, once the strength of teams they faced is taken into consideration. We can also view how the schedule-adjusted points compare against the actual points on a gameweek-by-gameweek basis in the following animation:
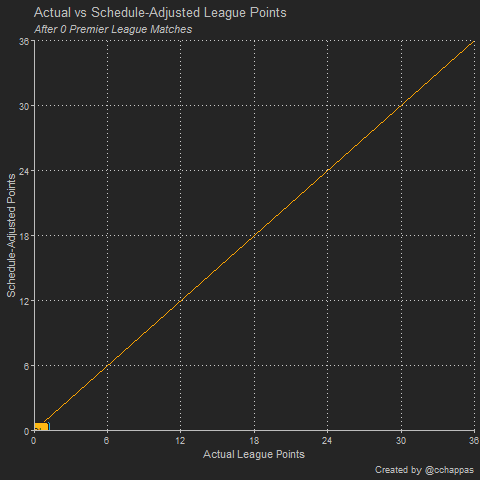
In a sense, teams above the 45-degree orange line are short-changed as the true worth of their points gained is more than the league table would suggest, whereas teams below it may be viewed as having a deceptively high number of league points given the true worth of those points. Alternatively, one could view the teams’ ranking on the horizontal axis as the actual league table and the teams’ ranking on the vertical axis as the schedule-adjusted league table.
As the season progresses, the points will approach the diagonal, before lying exactly on it in their final ranking, whichever that may be. Some additional notes on the methodology:
- It does not depend on any prior beliefs regarding the strength of each team. Therefore, a win against a presumed weak team which however has been getting results will contribute more compared to a win against a traditionally strong team which hasn’t been getting any league points.
- A team’s adjusted points might change even if that team does not play a match, conditional on other results. This means that the adjusted points gained from a win against a particular team might increase or decrease, depending on whether that particular team has been winning or losing subsequent matches. This provides a continuous update on the true strength of a team and therefore adjusts the value of points already gained by other teams against it.
- Any concept of “form” is not considered. As a result, the schedule-adjusted table would still be the same, even if we re-arranged the playing order of the matches up to that point.
- By construction, all teams are considered as equal at the start of the season hence the schedule-adjusted league table will appear compressed compared to the actual league table in the early stages of the season. This is corrected once the number of pairwise comparisons between teams increases, as that will provide additional information on the relative strength of each team.
- The schedule-adjusted table converges to the actual league table once all matches have taken place.
It should be stressed that this methodology can be extended and applied to other similar situations irrespective of the metric used. For example, given its recent popularity, one could use it to assess the true worth of xG figures registered by teams, once the difficulty of the opposition has been taken into account.
So there you have it!
This piece provides the idea and the methodology to produce schedule-adjusted rankings. Next time someone points at the league table to support an argument, get your calculator out and check if that table is indeed telling the truth.
Happy schedule-adjusting!